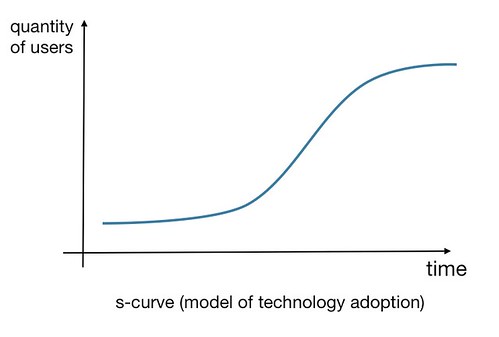
Spent last friday in Zürich presenting the Lift screening process and trend analysis with Holm Friebe's class at the Design Hochschule. The morning was about the Lift Conference, more specifically about our process to scout for speakers and ideas, to set a theme and work it out. The message was that the wide range of signals (ideas, memes, "trends", technologies, social phenomena, scientific discoveries, etc.) and inscriptions (books, magazine, blogposts, articles, academic papers) is scanned and filtered through different criteria: preference towards social implications than technologies for the sake of technologies, avoidance of technological determinism (as much as we can), stepping a bit from terms that are too *hip* (such as "web2.0"), etc. In the afternoon, we took some time to discuss different tools to filter the signals and forms of change. The tools are actually quite common and stem from the mix of methods we encountered in our work/readings/studies and meetings with lots of people. Most of the conversation addressed the use of s-curve, coming from diffusion theories of innovation. It shows how adoption is slow at first (depicted by a flat curve at the beginning of the time period) till a tipping point (the steep curve mid-way) and a plateau. This last phase corresponds to the adoption of the technology by adopters (which does not correspond to everyone on earth). To put it shortly, the s-curve is a way to represent the number of people who adopt a technology over a particular time period. As C. Christensen puts it, "it states that in a technology’s early stages, the rate of progress in performance is relatively slow. As the technology becomes better understood, controlled, and diffused, the rate of technological improvement increases . But the theory posits that in its mature stages, the technology will asymptotically approach a natural or physical limit, which requires that ever greater periods of time or inputs of engineering effort be expended to achieve increments of performance improvement"
Of course, we should distinguish the different ways to use s-curves. You have the sociological use where you draw the s-curve with real-data of technology adoption (as described in here). But you also have a more metaphorical use of the curve, which is the one we discussed in the course. Using a s-curve in this context is relevant to structure the discussion about where an innovation (technology, social change, etc.) stands at a certain moment in time, where it came from and where it might be in the future.
A good way to start drawing an s-curve, in the context of such discussion, is to look at different information sources: you can for example map data points depending on the information source represented on the following figure:
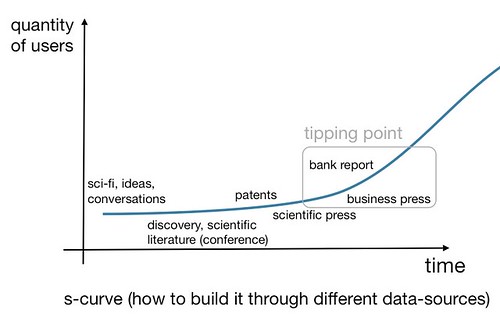
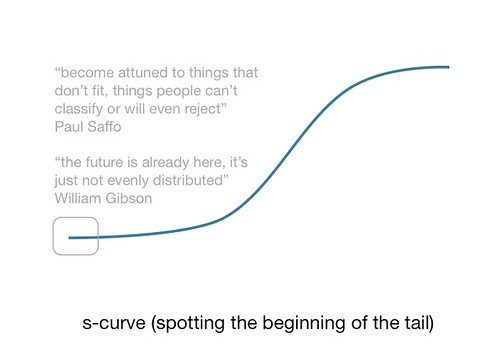
As one can see on the two figure above, there are two important points in s-curves:
- The beginning: that I exemplify through these 2 quotes by Paul Saffo and William Gibson. They simply show that s-curves' beginning are already here and the point is to spot them through different data sources (be they readings, field studies or always-on attitude.
- The tipping point: the moment in time when the rate of adoption increases, which depends both on technological improvements and, above all, on "contextual" issues such as " the active participation of all those who have decided to develop it" (see Bruno Latour's work about the "model of interessement"). On a methodological note here, I would say that the use of s-curve in conjunction with Latour's work may be a bit flawed. Will need to think this through later on.
Another way to see an s-curve and to discuss how to apply it to a certain innovation is to adopt a people/user/market viewpoint:
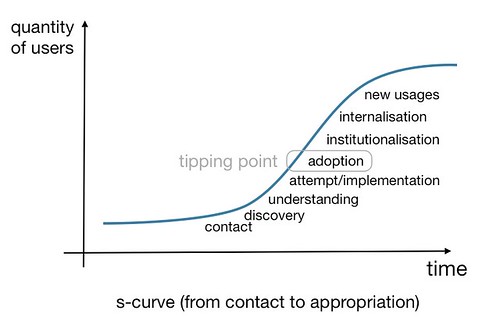
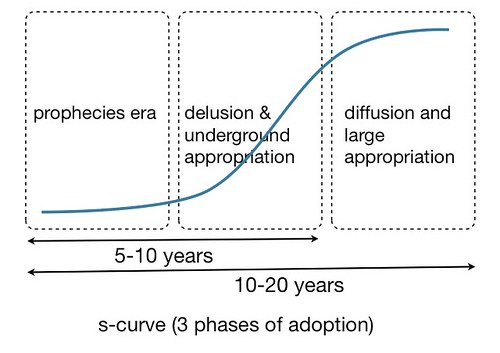
This standpoint can also be summarized by these three phases of idea/meme/technology adoption (based on Scardigli's work):
- Phase 1: The “time of prophecy and fantasy” (enthusiastic or terrifying) where revolutions are predicted and technique is “inserted socially” (right after invention and R&D). It correlates with a discourse around the hopes and fears linked to these issues which are recurring in history. What happen is that fantasy, scientific knowledge and actions are intertwined and even the weakest signal is turned into an excessive hope or fear. Prophecies become necessities and then self-justificated. Some example: "3D web platforms like Second Life will change the Web forever", "Mobile social software will be a revolution", etc.
- Phase 2: The “delusion phase” that suggest how the expected technological revolution does not lead to a social revolution. Or, when we realize that there is a gap between forecasts and realizations/effects. At the same time, some people start appropriating, adapting, using the idea/meme/technology differently. This is generally less publicized as the press thinks that the "innovation is a fad" and it's not worth talking about it.
- Phase 3: “the side-effect phase”: 20 or 40 years after, the real diffusion of the technique is effective and some social and more long term consequences appear but often different from the one expected at first. This is what happened with the video-phone, it never really worked as a independent box at home but people are now using it on their laptop through Skype; and it allows interesting new social dynamics and usages.
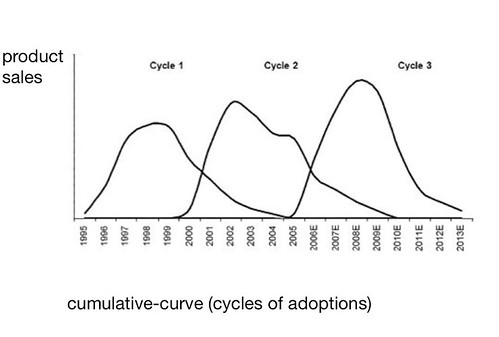
Of course, back to the evolution of technologies, you can also take a "sales" viewpoint: if you look at the rates of acquisition/sales instead of the adoption. For each product, you then this sort of succession of curves that represents cycles of adoption (video game consoles in this case):
Finally, we also discussed the importance to consider the large diversity of human behavior, which was depicted by this well-known Bell curve that I've taken from a book by Don Norman (who actually took it from G. Moore's book "Crossing the chasm").
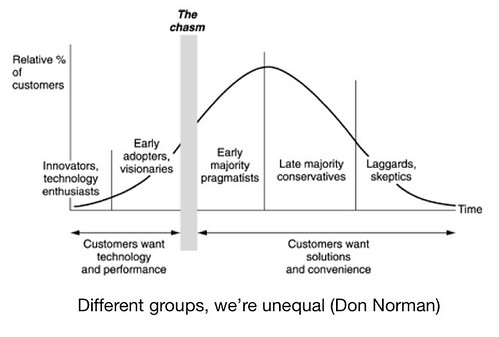
What we can draw from this curve is that:
- There is diversity, not juste "one normal human"
- People who are at the beginning of s-curves are the early adopters.
- You can be an early adopter for a certain topic (iphones) and a conservative person for others.
- Besides, this curve also relates to the previous representations in the sense that the s-curve can be seen as being made up a series of 'bell curves' of different sections of a population adopting different versions of a certain product
Why do I blog this? trying to formalize a bit the tools we used the other day is interesting as it forces to describe why and how they're relevant. It's important to point out, though, that these tools are definitely not a perfect algorithm/process to give you the answer about “how a signal would evolve into a fad or a success". Instead, they should be seen as a a way to structure the discussion of signals and topics we collect. Which is why I smiled when, few streets ahead in Zürich, I stumbled across the name of this company:
Thanks Holm for the opportunity!