Bitsybot has an interesting set of visualizations about Foursquare usage. Called Foursquare Trends, it shows users' behavior over time by visualizing a week’s worth of Foursquare checkins. Bitsybot is interested in using this to "develop a suite of similar tools to help small brick and mortar businesses understand their micro market landscapes":

Why do I blog this? another type of material that is relevant for our study of Foursquare usage. This type of graph is relevant as a way to show rythms and usage patterns. The example above is based on activity analysis (each activity actually corresponds to a certain set of places).
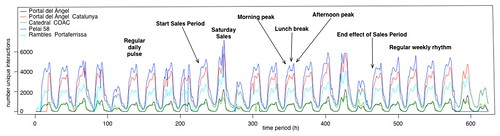
For us at Liftlab, it's also interesting to compare this to our current musings about spatial occupancy analysis. See for instance Fabien's work about:
"We retrieved a couple of months of records produced by 5 Bluetooth scanners, deployed by the Mobility Service of the city of Barcelona on light poles and traffic poles in the Barcelona city center in the Plaza Catalunya – Puerta del Angel – Rambla – Cathedral area. BitCarrier’s solution aggregated over 4 millions non-unique devices (about 1 million unique devices) into periods of 15 minutes, and we discarded the periods with less than 100 detected devices. The database provided a first understanding of the cyclical nature of passing Bluetooth traffic at the nodes and routes forming a connected graph of sensors."